Insight Paper November 3, 2016
The Philosophy and Process of Data Science

This TIP will explore a variety of topics including what makes a data scientist, the different types of data scientists, the importance of statistical work, and analytics workflow.
Definition of Data Science
Let’s start by defining data science and being clear that the most important word in the term “data science” is science; data science usually involves using the scientific method to prove or disprove a hypothesis with data. My colleague Mike Schillmoeller points out that some methods (e.g., dimension reduction, image analysis) don’t necessarily fall into the scientific method in a strict sense, but I’ll focus here on the aspects of data science that do. Like any other scientific endeavor, data science is the process of using sophisticated techniques to find information that’s initially hidden. Trexin’s definition of data science is simple:
Data science is the systematic extraction of knowledge from data, in order to gain a decision advantage.
What Makes a Data Scientist Different than an Applied Statistician?
To answer this question, we must first address exactly what being a data scientist means. There have been debates about the distinction between a data scientist and a statistician, so much so that articles such as Why Do We Need Data Science When We’ve Had Statistics for Centuries have emerged. Indeed, the two roles are extremely similar. Much of what a data scientist does (i.e., using scientific methods to liberate meaning from raw data) sounds almost identical to what an applied statistician does every day.
Bear with us as we consider a master artisanal French pastry chef. This is a person who can create high-quality treats through hours of painstaking, carefully designed and executed work. The result is delicious and rightfully expensive. The tradeoff is that artisanal chefs can only produce a small number of baked goods per day. Compare that to an artisanal bread shop, which has all the right ingredients laid out in a line, producing hundreds of loaves of bread on a daily basis, which is all the result of a carefully designed system of steps to get from flour, water, yeast and salt into the loaves you see at a high-end grocery store. There are makers of Wonder Bread too, but we’ll leave them out of this.
We think there’s an important distinction to be made between the two different types of bakers, or in our case, data scientists. Type A, the pastry chef, is something like a data scientist who creates one-off statistical analyses, typically delivered in person or on a phone call or email. Their product takes some time to develop and execute, but once complete produces an individualized result highly tailored to the consumer. Type B, the high-end bread shop, is more like a data scientist focused on producing an automated analytical process that can scale as needed; simply put, this kind of data scientist writes abstracted, transparent, repeatable code to do analysis, create models and produce graphical visualizations of the “story the data is telling”.
Both types of data scientists are highly valuable, and each can be perfect for a customer depending on their needs. In these TIPs, when we use the term ‘data scientist’ we will be referring to Type B data scientists. There will always be a need for Type A data scientists, but my own background and interests lie in automation, so we’ll make a distinction between the two groups by saying that data scientists must know how to write code, and I’ll approach data science from that perspective even though our definition of data science above doesn’t require that distinction. For a related discussion detailing the different types of data scientists, visit here.
With that in mind, in our view a data scientist must have three major pillars of knowledge. Clearly, they must understand statistics, including identification and avoidance of mistakes commonly made by beginners that invalidate statistical findings. They must understand something about the domain – healthcare, finance, manufacturing, and so on – in which they are operating, or at least be able to speak intelligently with subject matter experts in that domain. Finally, they must understand how to write software (i.e., computer code) to support scalability, automation and repeatability.
There are some fairly wild claims made from time to time that data science will make the work of statisticians irrelevant. Statistics is far from the least important part of a data scientist’s job, as some have suggested. It underpins everything a data scientist does; suggesting otherwise is dangerous. Our brand of data science does not do away with statistical analysis, it simply automates it and broadens its accessibility and scale.
The Advantage of “Type B” Data Science: Automation
The programming component of data science is pivotal, especially when looking to the future. Through automation, it adds three major strengths to the field of applied statistics: scalability, repeatability, and transparency.
First, automation brings scalability. There is such a high volume of data and accordant demand for analysis of that data that it can no longer be met by a relatively small pool of highly-skilled people doing one-off, custom analysis. Instead, just as spreadsheet software replaced legions of people adding columns of figures by hand, software written by data scientists can replace the bulk of the analysis process, leaving only the highest-level (many would say most interesting) pieces of the process for humans to do manually.
Another main advantage that automation brings is repeatability. No one is going to write code to perform multiple linear regression from scratch when many fine packages already exist to do that. Extending this idea to increasingly higher levels of abstraction, once a piece of statistical analysis is programmed, it is forevermore automated, and (in theory) no one has to do that work again. Data scientists can use that piece of analysis code as a repeatable building block, taking concrete analyses and abstracting out ever higher level functions. (Of course, there are many pitfalls to using code packages blindly without understanding their assumptions and limitations.)
Finally, having analyses made tangible by writing code that can be shared among peers and customers brings transparency to the process. Independent confirmation of hypotheses by independent researchers is a core component upon which much of the practical science process is built. Others can not only use your code and your results to inform subsequent analyses, but they can also inspect your work for any methodological or practical limitations or mistakes.
How Does Data Science Work?
The traditional scientific method has these steps (though many forms of this diagram are possible):
Trexin has modified the steps of a generalized scientific method into a comprehensive yet adaptable analytics process inside an iterative framework. The “observation” in the diagram above is a business driver of some kind, often a realization that a company’s data is itself a valuable asset. “Experiments” take the form of data analysis and modeling; and accepting or rejecting a question or hypothesis is equivalent to evaluating a model.
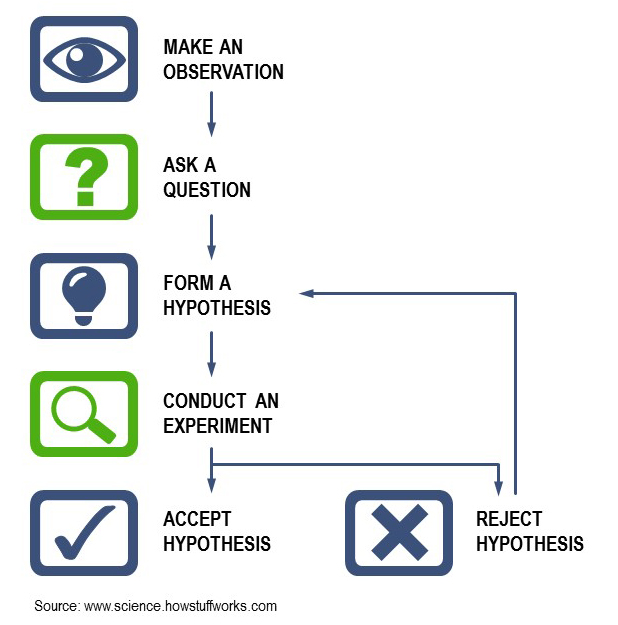
The iterative nature of Trexin’s process reflects the fact that many experiments, not just one, will be required to answer a question – just as in the history of applied natural sciences like physics, answering fundamental questions about the physical nature of the world. We are likely to make several revolutions around the circular process before arriving at an end result. Let’s look at each of the major steps in turn.
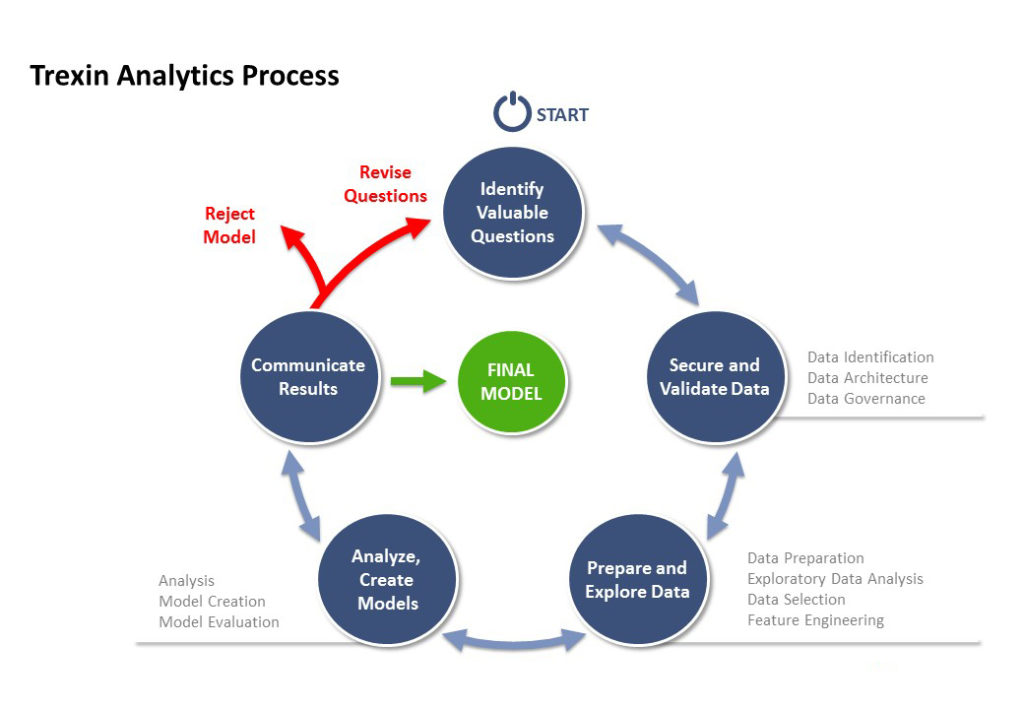
Step One: Identify Valuable Questions
This highly-collaborative step is critical for almost all analysis. The goals of this step include the identification of high-value, unanswered business questions and hypotheses as well as the establishment of executive support. It requires interviewing sponsors and stakeholders, documenting key unanswered questions, establishing priorities, suggesting other questions, hypotheses and avenues to explore, and ensuring alignment with business goals. To achieve this step requires a degree of domain specificity and data specialization, as well as business analysis and input from data scientists. This step must be executed in an especially careful fashion, as it forms the building block for the remainder of the process. Be wary of analyses that begin without clear questions to answer – or vendor claims to be able to provide “insights” without this fundamental step being in place.
Step Two: Secure and Validate Data
This three-layered step sets three goals: 1) understanding raw data meaning and quality as well as engaging appropriate data owners; 2) putting appropriate infrastructure and tools in place to support data analysis, and 3) ensuring that processes and policies are in place to ensure appropriate data governance and security. In more complex environments, it requires several tools and skills, including data architecture and Master Data Management (MDM). Typically, this step entails identifying what data is necessary, what type of data stores and infrastructure are necessary, and identifying data ownership, processes, and relevant policies to secure and maintain data.
Step Three: Prepare and Explore Data
In this step, data is prepared for analysis, requiring a deeper understanding of data quality, patterns, and structure, verifying and amending the business question, excluding irrelevant data, and identifying key predictive inputs. There are a number of steps necessary to actualize this portion of the process, typically one of the most time-consuming aspects of analysis. It requires detecting and addressing missing data and outliers, analyzing frequency distributions, looking at correlations, assessing initial model structure, deriving meta data and creating new higher-order features, reporting summary results, determining if any data segments need to be excluded from analysis and modeling, and possibly adding synthesized data to address missing elements. To execute these steps, one needs to have a variety of statistical analysis tools as well as the appropriate statistical and data science core skills to use them.
Step Four: Analyze, Create Models
Beginners in the field of data science often want to leap to this step without having properly addressed the first three, with predictable (pardon the pun) results. The goals of this step are simple: to create one or more inferential or predictive models that support the holy grail of data science: “actionable insights”. The sad reality is that this isn’t always possible – see our TIP “Managing an Analytics Project” for details on the distinction between findings and actionable insights, and a great quote from John Tukey.
Inferential models often use the full data set to infer meaning about the population being modeled; these are the classical statistical models using concepts developed over the last century and more. They are evaluated using a set of techniques specific to the model, the data, and the questions being asked. Predictive models, by contrast, attempt to predict individual outcomes rather than population summaries. They’re typically trained using a sample of the full data set, then validated against test data that’s “held out” specifically for testing. Some predictive models use classical statistical algorithms and methods like linear regression, while others, especially those featuring so-called unsupervised learning, are relatively new and specific to the field called “Machine Learning”.
Step Five: Communicate Results
This “last mile” step is often performed ineffectively, with the result that analytics findings that could drive true value from data don’t propagate out of the department performing the analysis, rendering the analytics process effectively useless. Data visualization, reports, and/or interactive tools thoughtfully created by an experienced practitioner can help convey findings, insights and recommendations that create value from data. However, being effective at this step requires a deep understanding of business needs and human perception, years of trial and error to strike the right balance of level of detail for various audiences, and current knowledge of available tools.
After this step completes, there are several possible outcomes:
- In the best case, there could be a final set of models that fully answer the questions posed. Results from inferential models might be used to help publish medical journal articles, suggest a stock trading strategy, or support a manufacturing decision. Predictive models may be operationalized to detect fraudulent transactions, suggest optimal treatments for a patient newly diagnosed, or forecast the size of an investment needed.
- Typically, however, after a single loop through the process, there’s a much deeper understanding of the data and what it’s telling us; we use that to refine the questions being asked, and from there refine the models, sometimes in significant ways that require additional data. At that point, the process starts again from the top with securing, validating, exploring and preparing the data to answer the next question.
Summary
We’ve covered a lot of ground. To recap the main points of this TIP:
- Trexin defines data science as the “systematic extraction of knowledge from data”, and sees the scientific method as the fundamental underpinning of our process. We believe that the most important word in the phrase “data science” is science.
- Though fully respecting applied statisticians and their work, for the purposes of this series, we’ll make a distinction between them and data scientists by saying that data scientists must know how to write code, even though our definition of data science doesn’t require that distinction.
- The advantage of adding coding as an explicitly required step in the data science process brings three major strengths to extend the field of applied statistics: scalability, repeatability, and transparency.
- Trexin uses a proven iterative process to structure its data science work that brings together decades of collective experience to avoid common pitfalls. Beginners to the data science process often underestimate the need for each one of the steps in the process. The process is comprehensive but needs to be applied thoughtfully and carefully to deliver maximum value.
References
Chang, R., (2015). Doing Data Science at Twitter A reflection of my two-year Journey so far.
https://medium.com/@rchang/my-two-year-journey-as-a-data-scientist-at-twitter-f0c13298aee6#.p5lrbi15r
Wladwawsky-Berger, I., (2014). Why do we need data science when we’ve had statistics for centuries? https://blogs.wsj.com/cio/2014/05/02/why-do-we-need-data-science-when-weve-had-statistics-for-centuries/